Introduction
Monoclonal Antibody aggregation generally occurs as the result of either conformational or colloidal instability. Conformational stability is the free energy difference (ΔG) between folded and unfolded states. Although not direct measurements of free energy, melting temperature value (Tm) and aggregation temperature (TAgg) can be used as qualitative assessments of conformational stability. Colloidal stability is determined by the balance of repulsive and attractive intermolecular interactions between protein molecules, like a monoclonal antibody, to conserve the native folded state. Simply stated, the propensity for aggregation is reduced by less intermolecular interaction. Therefore, determination of the second virial coefficient (B22) is a valuable screening tool to predict aggregation propensity. ARGEN™ is the ideal tool to assess quantitative and qualitative properties of all classes of biotherapeutics and determine TAgg, B22, molecular weight (Mw), as well as changes in weight average molecular weight (aggregation) under various thermal, chemical, and mechanical stress conditions. This technical note outlines the method in which ARGEN™ is utilized to determine the second virial coefficient (B22) and molecular weight (Mw) of a monoclonal antibody.
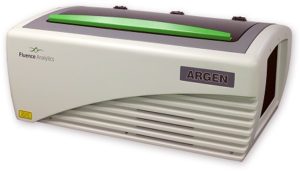
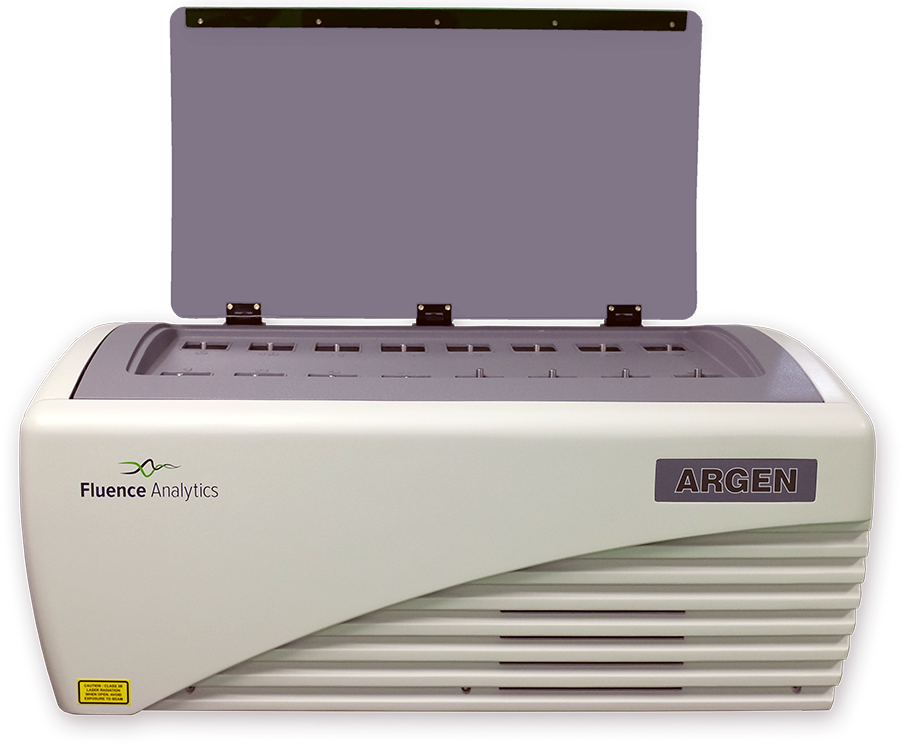
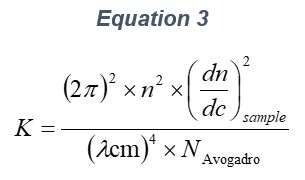
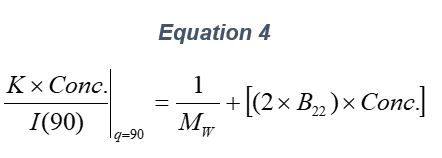
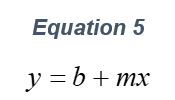
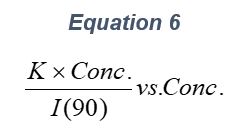
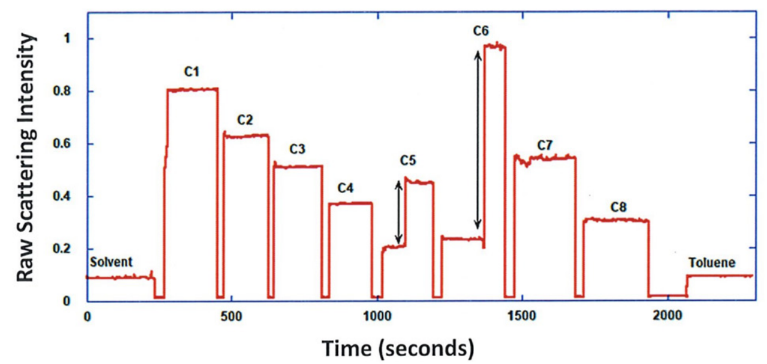
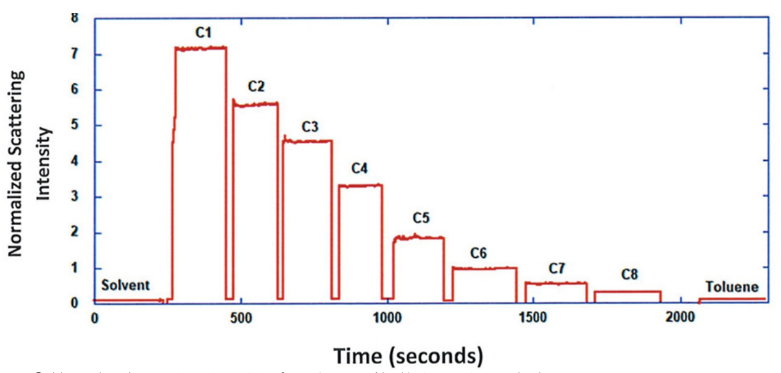
ARGEN™ is a high throughput tool for the rapid assessment of the stability and viability of therapeutic proteins, peptides, and biopolymers. The instrument uses a multi-stressor testing platform powered by static light scattering detection and intuitive data processing. These features enable teams to develop biologic formulations up to 16-fold faster. ARGEN utilizes fixed angle (90°), simultaneous multiple sample light scattering (SMSLS) technology which provides rapid, real-time, continuous data collection for characterizing qualitative and quantitative properties of target molecules. The device is equipped with 16 independently controlled sample cells, permitting the user to establish thermal, chemical, and mechanical (stirring) stress parameters on each sample concurrently. This allows for a highly flexible approach to experimental design. The ARGEN™ control software features an intuitive interface for all aspects of experimental design and independent control of each cell for parallel parameter adjustment and real-time data processing. ARGEN detects the intensity of scattered light (90°) from a solution subjected to a vertically polarized laser source. The intensity of the scattered light is directly proportional to the size and concentration of the molecules analyzed as defined by the Zimm equation (Equation 3) and determined by solving for the excess Rayleigh ratio (Equation 1). Below is the equation used to calculate excess Rayleigh light scattering intensity “I” at a 90° scattering angle: When determining the molecular weight of a synthetic or natural polymer, the Zimm approximation is made at a low concentration when q2 <S2>z << 1. The following equation can be used for a polydisperse polymer population: ARGEN automatically determines the value of K upon entry of n and (dn/dc)sample on the experiments page. Within the limitation of measuring scattering at 90°, the Zimm Equation reduces to: Or simply: With these values, a Debye plot can be generated using Equation 6: The Y-intercept is equal to the 1/Mw of the molecule in solution, and the slope of this plot is equal to 2x the virial coefficient (B22) as displayed in Figure 3. A 2 ml stock solution of [mAb] = 0.05 mg/ml was prepared and subsequently syringe-filtered using a 0.22 μm cellulose acetate filter. All data was collected at 10 Hz. After establishing solvent baseline and standard scattering intensities, filtered buffer solution was used to dilute the stock monoclonal antibody sample to [mAb] = 0.05 mg/ml. Since there is a significant increase in scattering intensity between the solvent and mAb solution, the neutral density (ND) filter was adjusted to mitigate scattering signal saturation. Next, the sample was serially diluted, and scattering intensities were collected for each dilution in series. When the scattering signal was <20% of the maximum, the ND filter was adjusted to increase signal intensity as depicted in Figure 1 (steps C5 and C6). Normalized scattering intensities for each dilution are shown in Figure 2. Raw scattering intensities were scaled and normalized to zero neutral density. Scaled scattering intensities (Scaled SLS) for each dilution, solvent, toluene as well as Rayleigh scattering intensities (I(90)(cm-1))) and values of K*Conc. / I(90) (mol/g) are shown in Table 1. To determine K (optical component), the index of refraction for the buffer solution was assumed equal to that of pure water, therefore, n = 1.33. Additionally, the published differential index of refraction increment for monoclonal antibodies is dn/dc = 0.185 cm3 /g with K= 2.089E-7 mol*cm2g-2. The Y-intercept of the linear fit (regression) indicated that the molecular weight of the monoclonal antibody = 151,600 g/mol, and the second virial coefficient is 3.3E-05 mol*cm3 /g2 (Figure 3). These values correlate with reference values found in literature. These experiments demonstrate the utility of ARGEN to determine molecular weight (Mw) and the second virial coefficient (B22) of a monoclonal antibody. The quantitative and qualitative measurements permitted classification and an understanding of the propensity for aggregation in a variety of solution conditions. Furthermore, the high throughput capacity of ARGEN allows users to analyze up to 16 samples or conditions simultaneously, vastly reducing time and resources required for development. ARGEN™: Smart & Rapid Therapeutic Biopolymer Development
How ARGEN™ Works
ARGEN™ Intuitive Control Software
Equations & Roadmap for Determining Mw & B22 Using SLS (90°)
Step 1: Calculating the Excess Raleigh Ratio at 90°, I(90)

Step 2: Mw & B22 Determination Using the Zimm Approximation

Experimental Methods
Sample Preparation: Solvent & Standard (Toluene) Scattering Baseline Determination for Monoclonal Antibody
Experimental Results
Parameters for Debye Plot
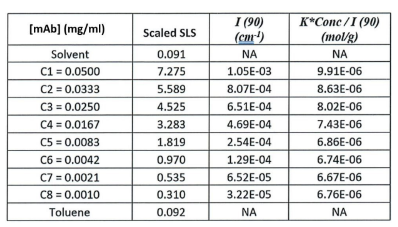
Debye Plot Analysis for Monoclonal Antibody
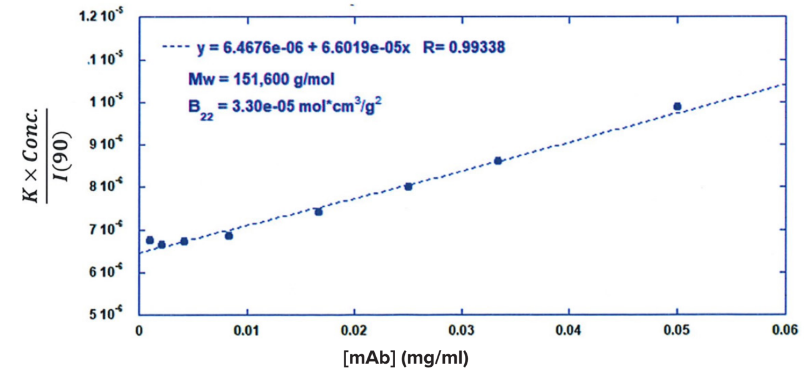
Conclusion

