Why this matters
Polyurethane polymerizations are industrially significant with applications in furniture, construction, electronics, automotive, footwear and many other fields. Polyurethane polymerizations are often synthesized from a low molecular weight prepolymer, which is then used to manufacture shaped articles through additional polymerization. ACOMP performs a continuous sampling of polymerization reactor contents and monitors properties including molecular weight, viscosity and monomer conversion or concentrations in real time.
By applying ACOMP in the prepolymer stage of polyurethanes, polymer properties such as molecular weight or viscosity are monitored. This allows for improved yields, reduced off-grade materials, and tighter product specifications, enhancing the ease of subsequent processing and end-use performance.
Overview of Polyurethane Polymerizations
The global polyurethane market was valued at around $56 billion in 2020. With applications in furniture, construction, electronics, automotive, footwear and many other fields, polyurethanes touch every aspect of our lives.
Polyurethanes are very versatile as polymers in that they can take many forms such as foams, adhesives, elastomers and coatings. Various mechanisms of polymerization such as thermal, radiation cure, or reaction injection molding are commonly used. Polyurethanes are condensation polymers formed by the copolymerization of a difunctional alcohol and an isocyanate. Industrially, the most common comonomers are ethylene glycol (EG) and toluene diisocyanate (TDI).
ACOMP is an advanced monitoring system for polymerization reactions that is capable of tracking the progress of reactions like the polyurethane condensation reaction in real time, while also monitoring polymer properties including weight-average molecular weight (Mw) or intrinsic viscosity. These properties are critical for determining the properties of the end product.
In this technical note, we will introduce the use of ACOMP for monitoring two types of polyurethane polymerizations. The first is the industry standard, which uses EG and TDI as comonomers, and the second is a novel type using a non-toxic isocyanate monomer. The ACOMP system can monitor in real time the intrinsic viscosity and molecular weight for the stepwise polymerization reaction that occurs forming carbamate (urethane) bonds to yield low molecular weight prepolymers. In the polyurethane industry, such prepolymers are frequently employed in a subsequent process such as reaction injection molding which forms final parts, so control of their properties is critical.
Commodity Monomers
ACOMP was used to monitor the polyurethane polymerization between EG and TDI in solvent dimethyl sulfoxide (DMSO). The reaction was carried out in a 200 ml vessel with the monomers added to the reactor and heated to 120°C. The reaction was carried out for two hours, and it was then quenched with ethanol and the polyurethane was precipitated out by pouring it into water. Two reactions were run at different monomer molar ratios. Table 1 shows the molar ratios and masses.
| Reaction | EG (g) | TDI (g) | Molar Ratio TDI:EG |
| Run 1 – 4/19 | 7.80 | 14.75 | 0.744 |
| Run 2 – 4/21 | 3.93 | 8.68 | 0.901 |
Table 1: Polyurethane run conditions
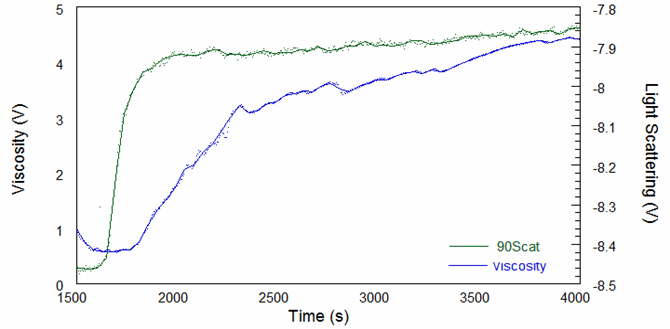
The raw viscosity and 90-degree light scattering signals from the first experiment are shown in Figure 1. The reaction is highly exothermic which caused the reactor temperature to vary significantly; however, these fluctuations do not affect the measurements since the inside of the ACOMP is a temperature-controlled environment. Because of this, ACOMP provides a robust means to characterize a polymer even in a rapidly changing process environment.

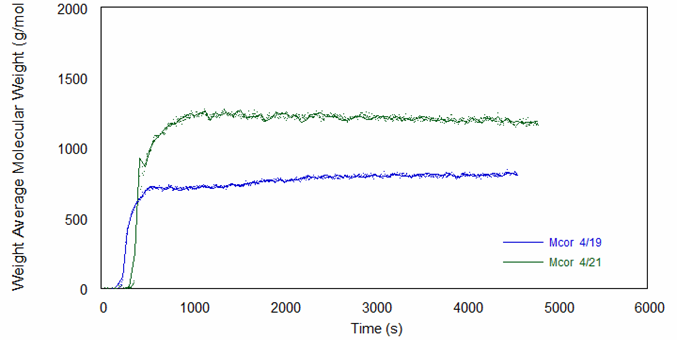
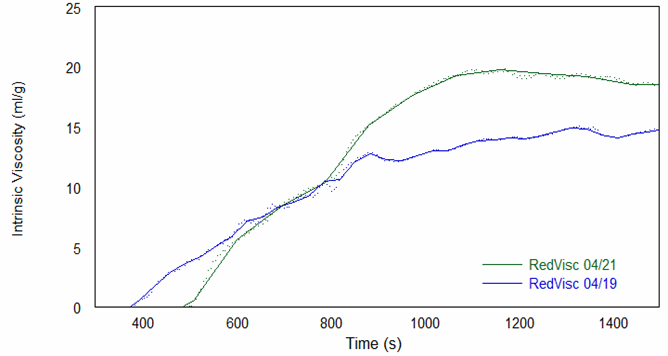
The online molecular weight results for both runs are shown in Figure 2, and they demonstrate that molecular weight increases versus time to a plateau at quite low molecular weight values. Figure 3 shows the online intrinsic viscosity values.


As shown by these results, the polyurethanes prepared in the two experimental runs varied significantly in their molecular weights and intrinsic viscosity profiles, likely due to process variations such as reactor temperature and solution (bulk) viscosity. Because of these variations, which would likely also be seen in an industrial environment, the reaction kinetics did not follow a simple model. Despite this, ACOMP is capable of tracking the evolution of key properties over the duration of the reaction.
Specialty Comonomer
We now turn to a different polyurethane system using a specialty isocyanate, isophorone diisocyanate (IPDI) [1]. IPDI was chosen because it is a readily available monomer used in producing UV-resistant PU resins and has reduced toxicity compared to the standard TDI. Real-time monitoring of this polyurethane polymerization is particularly interesting because it has unequal reactivity of its isocyanate groups, which depend strongly on catalyst choice. Monitoring these reactions in real time could allow for screening of less toxic catalysts or rapid development of effective catalysts for material engineering. Figure 4 is a depiction of the reaction catalyzed by triethylamine (TEA).

For these reactions, DMSO was again selected as the solvent due to the polymer’s excellent solubility in it and its suitable optical properties. The solvent was first charged into a 250 ml flask and purged with nitrogen followed by the EG, IPDI and TEA. The two recipes are shown in Table 2.
| Run | IPDI (mol) | EG (mol) | IPDI/EG | Temp. °C |
| 1 – Batch | 0.052 | 0.053 | 1 | 93 |
| 2 – Semi-batch | 0 -> 0.052 | 0.053 | 0 -> 1 | 87 |
Table 2: Specialty polyurethane run conditions
As with the previous TDI case, due to the low concentration of the polymer, the reactor contents were directly recirculated through the detector train and then back to the reactor. A differential refractometer and a Fluence Analytics custom-built single capillary viscometer were used to monitor the reaction kinetics and polymer reduced viscosity. The monomer IPDI is iso-refractive with the solvent so the DRI detector allows the incorporation of EG into the polymer chain to be monitored directly in real time.
As with the industrial monomers, two reactions were monitored. The first run was a batch reaction at 93°C, with 100 ml of DMSO charged to the flask. After heating the solvent to the desired temperature, 3 ml of EG and then 11 ml IDPI were added. The second run was in a semi-batch mode, continuously feeding 22 ml per minute of a 50% mixture of IPDI and DMSO. The reactor was initially charged with 89 ml of DMSO, and EG was charged to the reactor flask. The catalyst TEA was added, and the IPDI feed was started at 0.1 ml/min.
Figure 5 shows the DRI signal for both reactions. In the batch reaction the refractive index signal, due entirely to EG in this case, rises rapidly as the EG in polymeric form rapidly reaches a plateau in its low molecular weight state.
In contrast, the RI for the semi-batch reaction, also due entirely to EG, begins at the same level as in the batch (since the starting EG concentrations were the same) but increases slowly and initially with a concave profile because the EG requires IPDI to react. The blue curve is thus a direct visualization of how reaction kinetics can be controlled by the semi-batch feed of IPDI. In both reactions, the refractive index reaches the same asymptotic value, which is the refractive index of EG in polymeric form.

During the semi-batch reaction, the flow of monomer IPDI was started at 0.1 ml/min, then halted, and increased to 0.2 ml/min. Figure 6 shows reduced viscosity vs. time, and the effects of stopping and restarting IPDI feed are clearly visible. As expected, the semi-batch reaction is far slower than the batch reaction, due to both the slower semi-batch feed of IPDI and the resulting lower temperature. The batch reaction is close to completion after 30,000 seconds, but the semi-batch reaction took much longer due to the gradual monomer feed.
Figure 7, showing weight-average molecular weight, displays the same trends. While the batch reaction proceeds at its own predetermined pace, feeding IPDI in semi-batch mode allows for the control of the viscosity and molecular weight of the prepolymers.


Conclusion
ACOMP has demonstrated the ability of online monitoring of low molecular weight polyurethanes in the prepolymer range. Reduced viscosity and light scattering detection are frequently used with ACOMP. The former correlates with the viscosity-average molecular weight while the latter gives a direct and continuous measurement of weight-average molecular weight. This technical note also shows how refractive index can monitor the kinetics of polyurethane polymerizations with various monomers in real time. In addition, it was demonstrated that semi-batch feed of the monomers can directly control the kinetics of the reaction, as well as the resulting properties of the polymers with less fluctuation in temperature.
These advantages ACOMP offers in the monitoring of polyurethane polymerizations can potentially be deployed in applications for the industrial synthesis of low molecular weight polyurethanes. ACOMP applications are rapidly expanding and will be enabled for many other polymerization reactions. ACOMP’s mission is to optimize production efficiency and quality during polymer production by generating real-time data streams.
References
1. [1] “A method for monitoring the step growth polymerization of polyurethane from isophorone diisocyanate and ethylene glycol”, Natalie C. Leonardi R., Harrison Rahn, Nurettin Sahiner and Wayne F. Reed, presented at American Chemistry Council, Polyurethanes Technical Conference, Oct. 2, 2017


